Unomi 3 · Metrics
Unomi 3 in numbers
How the codebase, tests, community, downloads, and website traffic grew from Unomi 1 through Unomi 3.1.
Unomi 3 is not only new features — multi-tenancy, OpenSearch, shell CRUD, tracing, and the task scheduler. It is also a step-change in how much of the platform is covered by automated tests, and how the Java surface area evolved across a decade of releases.
The charts below use release tags as waypoints:
Unomi 1 = unomi-root-1.9.1,
Unomi 2 = unomi-root-2.7.0,
Unomi 3.0 = unomi-root-3.0.1,
Unomi 3.1 = current master (work in progress after 3.0.1).
Counts are physical lines of code and approximate JUnit @Test annotations from the git tree at each tag.

Lines of code
Production Java grew from about 45k lines in late Unomi 1 to about 70k in Unomi 2 and 71k at Unomi 3.0.1 — then jumped to about 118k on the 3.1 line. Test Java stayed modest through 3.0 (~12k) and then leapt to about 63k with the unit harness, multi-tenancy coverage, and related work.

Methodology: physical line counts over .java (and primary companion sources for totals elsewhere) from git archive at each tag; paths under target/ excluded.
“Main” is everything outside src/test/ and itests/; “Tests” is those trees.
Unit and integration tests
Integration tests have been Unomi’s historical strength — growing from roughly 128 IT @Test methods in 1.9.1 to about 388 on 3.1.
The dramatic change is on the unit side: from a few dozen methods through Unomi 2 to about 1,148 on 3.1, driven by the in-memory persistence harness and denser service-level coverage.

- Unit classes — 11 → 12 → 15 → 66
- IT classes — 25 → 44 → 43 → 63
- Test / main Java ratio — ~0.19 in 1.x, ~0.17 in 2.x, ~0.53 on 3.1
That ratio shift is intentional: Unomi 3 invests in fast feedback for rules, persistence, and tenancy while keeping the heavier IT suite for end-to-end confidence. See also the unit testing harness and clearer IT execution.
Contributors
The project has grown to 77 unique authors on the master ancestry (name-based; some people appear under multiple spellings), with about 2,769 commits through current master.
Late Unomi 1 already had a broad base (~62 authors); Unomi 2 and 3 continue that trajectory rather than restarting it.

Top committers historically include Serge Huber, Thomas Draier, Abdelkader Midani, Sergiy Shyrkov, and many others who shaped incubating 1.x through the 3.x platform leap.
Downloads
Apache Infra publishes monthly CDN hit logs for Unomi on
infra-reports.apache.org
(hosts dlcdn.apache.org and downloads.apache.org).
From July 2023 through mid-July 2026 that is about
43k software-package hits in total (binary + source archives) —
that figure includes bots.
Of those, about 25k (~58%) are identifiable as bots or scripts
(Python Requests, scrapers, GPTBot, curl/wget, HeadlessChrome, and similar),
leaving about 18k from recognizable human browsers
(the purple series below).
ASF’s coarse UA labels will miss some bots, so the human count is likely still a bit high.

Methodology: classify each file’s useragents labels into human browsers vs known bots/scripts
(plus a small unknown bucket), then cumulate over the available months.
Solid purple = human browsers only (bots excluded);
solid teal = all software-package hits (bots included);
dotted muted purple = identified bots/scripts only.
Manuals/PDFs are excluded from all three series. Stats start mid-2023; July 2026 is partial.
Vertical markers: teal 2.7.0 (Sep 2025 release), amber 3.0 (Nov 2025),
and purple Site refresh (Feb 2026 website modernization).
Bot detection is only as good as the coarse UA labels ASF publishes — some automated clients
(or bots spoofing a normal browser) will not be flagged, so the human series is a best-effort lower-noise estimate,
not a guarantee of bot-free traffic.
Where downloads come from
Country totals use the same bot filter: each file’s cca2 hits are scaled by that file’s human-browser share
(ASF does not publish a full country×UA cross-tab).
After filtering, the densest human-attributed package volume is
Brazil (~24%), China (~18%), Russia (~17%),
the United States (~12%), and Germany (~8%),
with a long tail across Europe and Asia (~102 countries with attributed human traffic).
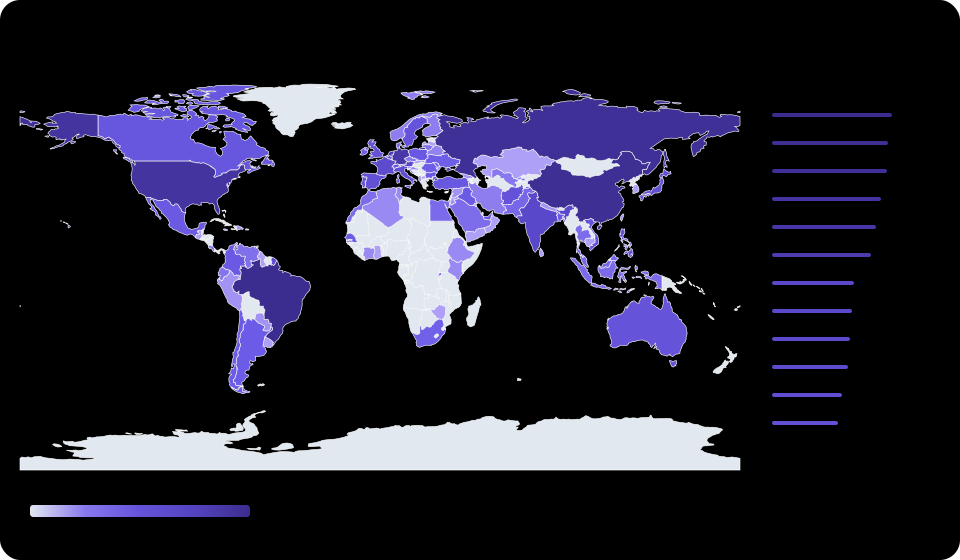
Map colors use a log scale. Geo still comes from CDN IP attribution, so mirrors, cloud egress, and VPNs can skew rankings even after UA filtering. Hover a country in a supporting browser for its estimate.
Website visitors
Separately from CDN package logs, ASF runs Matomo analytics for unomi.apache.org (site id 61). Across the available reporting window that is about 29k visits and 63k actions, with roughly 2.2 actions per visit, about 91 seconds average time on site, and a 67% bounce rate. Monthly series in Matomo are populated from January 2025 onward (the site record was created mid-2024; earlier months are empty in the API).

Traffic is mostly desktop (~88%), arrives primarily via direct entry and search engines, and is led by visitors attributed to the United States (~45%), then China, India, and the United Kingdom. Top content is the home page, Getting Started, Documentation, Use Cases, and Download.

Source: analytics.apache.org (public Matomo Reporting API). Matomo applies its own bot filtering, so country mix here will not match CDN download geography. Figures are visits (not unique visitors for the full range — Matomo disables that metric on long ranges).
What the numbers mean
- 3.0 was the platform cut — LOC and IT counts look close to late 2.x; the runtime floor (Java 17, ES9, clustering) landed without ballooning the tree.
- 3.1 is the product + quality leap — multi-tenancy and ops features arrive together with a much denser unit suite.
- Community continuity — contributor growth is cumulative; Unomi remains a long-running ASF codebase with steady authorship.
- Steady distribution — after excluding known bots/scripts (~58% of package hits), human browser downloads still show continuous uptake across three years of logged CDN data.
- Site interest holds — Matomo shows a steady ~1.5–1.9k visits/month through 2025–2026, concentrated on getting-started and docs paths.